User Guide
Billing Data BI Dashboard Setup
Overview
In addition to the Kubernetes visibility that CloudNatix offers, we also have a cloud cost visualization offering through Superset. This feature enables CloudNatix to process your AWS CUR files, extend them through extra processing, and make the data visible through Superset. In addition to providing dashboards generated by default, we enable creation of custom charts and dashboards to easily get all of the information that you need.
Requirements and Setup
To enable this system for you, CloudNatix will need access to an S3 bucket containing your AWS CUR files. Once this access is granted CloudNatix will copy your files to a bucket of our own, process and store the data, and present the data. To start this setup please contact a member of CloudNatix staff at support@cloudnatix.com or on Slack, and we can start this process together.
Getting Started
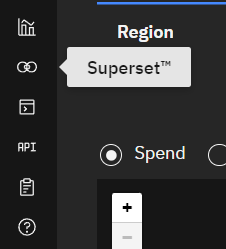
After the initial steps have been taken, CloudNatix will monitor the S3 bucket provided for new CUR files and automatically ingest the data and present it to our Billing Data BI Dashboard. This can be accessed through the Superset link icon in the bottom left of the CloudNatix web platform that will launch the dashboard hosted by Superset.

At this landing screen you can now see the Dashboards and Charts that CloudNatix provides by default. At the time of writing this, we include “Overview”, “Storage”, “Compute”, and “Compute cost for <Org Name>” for each Org in your CloudNatix Tenant. Using the information in these dashboards you can hit the ground running to understand your system, and if you want to customize your dashboards it is quick and easy to extend them.
Customizing your System
One of the key value propositions of our dashboard is that you can easily extend and create visualizations to fit your business needs. To do this all you have to do is create a chart and integrate it to whatever dashboard you want. Creating a chart is as simple as navigating to the “Charts” section, choosing “+ Chart” in the top right corner, selecting your billing-aws dataset, and getting to work choosing what you want out of your chart!
Queryable Access
An implicit but significant aspect of our Billing Data BI Dashboard is that we enable you to directly query your CUR data. But we don't stop there, we also enable you to query the enriched data that we provide on compute, all through the Queries section of the application! Although the queries are done in SQL, you can also export back to CSV format if that is your preffered method of working with data!

