User Guide
Understanding Infrastructure Cost and Efficiency from Dashboard
Overview
CloudNatix provides users with Dashboard that provides a bird's-eye view of their global cloud infrastructure footprint. CloudNatix provides an access controlled view of cost, resource utilization, and any cloud waste as well as workload overview.
CloudNatix Dashboard is context sensitive and can be used to view an entire company or an “Organization” within the company’s global cloud infrastructure overview.
Accessing Dashboard
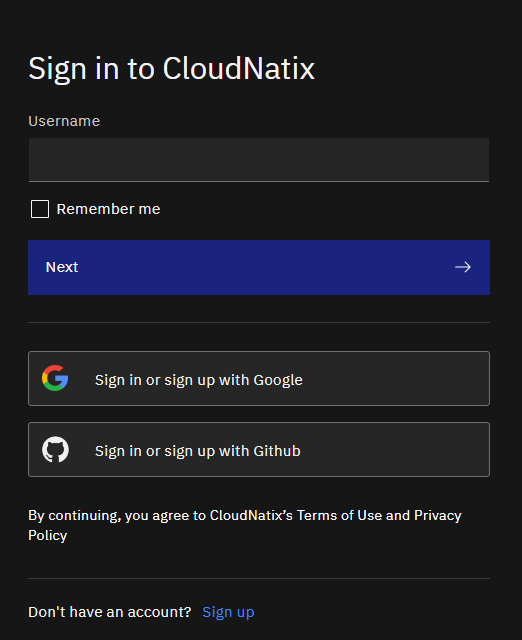
CloudNatix Dashboard can be accessed via http://app.cloudnatix.com/. You can use CloudNatix provisioned username and password to login into the Dashboard, you can choose a sign up/in with Google SSO or GitHub SSO.
The top section of the dashboard provides bird's-eye view with guided next steps.
The bottom section of the dashboard, named "Infrastructure Cost & Performance", displays more detailed information. In this section you can view data categorized by region, Cloud Service Provider (= CSP), organization, namespace, and much more
Bird's-eye view
The panels on the bird's-eye view row show an overview of all your environments, including usage and capacity of resources, cost saving opportunities, and their trends.
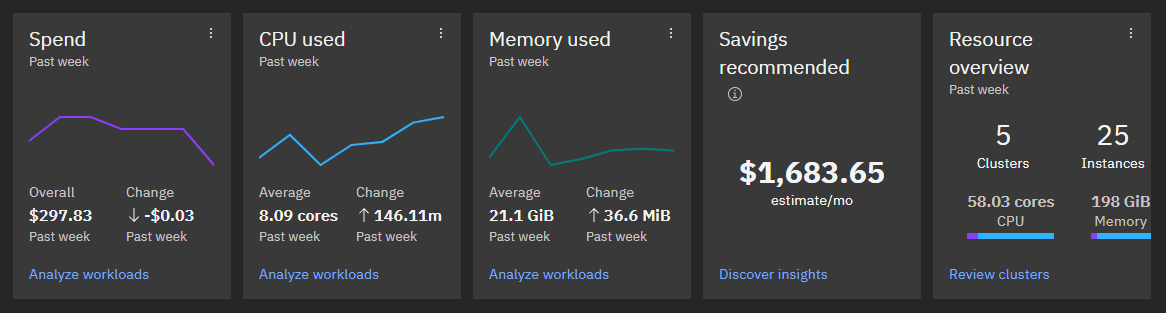
The "Spend" panel shows the overall spending. In the "Past week" and "Past month" view, each point in the chart represents one day. In the "Past 6 months" view, each point in the chart represents one week. "Total" shows the total spending for the selected interval. "Change" shows the change from the beginning of the interval to now.
The "CPU used" panel shows the overall usage of CPU cores. When suffixed with "m", it's a value in millicores. "Average" shows the average CPU usage for the selected interval. "Change" shows the change from the beginning of the interval to now.
The "Memory used" panel shows the overall usage of memory as well.
The "Savings recommended" panel shows the total potential savings of the optimizations CloudNatix recommends. You can view those recommendations on the "Insights" page, which you can jump to by clicking the link at the bottom of the panel.
The "Resource overview" panel shows the overall scale and resource capacity of your environments.
For the panels with a calendar icon at the top left, you can click it to change the interval.
The link at the bottom of each panel navigates you to the page where you can perform more detailed analysis and take actions for optimization.
Infrastructure Cost & Performance
The bottom section of the dashboard allows you to analyze resource usage and cost with various breakdown.
For example, the "Region" tab groups and visualizes metrics based on the region of the resources. Next to the visualization (map, chart, etc.), there's also a table with more detailed data.
The "wasted spend" value on the charts and tables shows a rough evaluation of how much of the spend is not utilized. This value is computed by multiplying the cost of each compute instance by the average resources left unused of the instance. Please note that there is always a gap between "wasted spend" and the total potential savings as there are cases where underutilized resources cannot be fully optimized (e.g., lack of smaller instance types, leaving head room for fluctuations).
Namespace cost
The "Namespace" tab shows the cost and performance data grouped by Kubernetes namespaces. As shown in the screenshot below, you can easily identify which namespaces are more expensive than others and their resource efficiency.
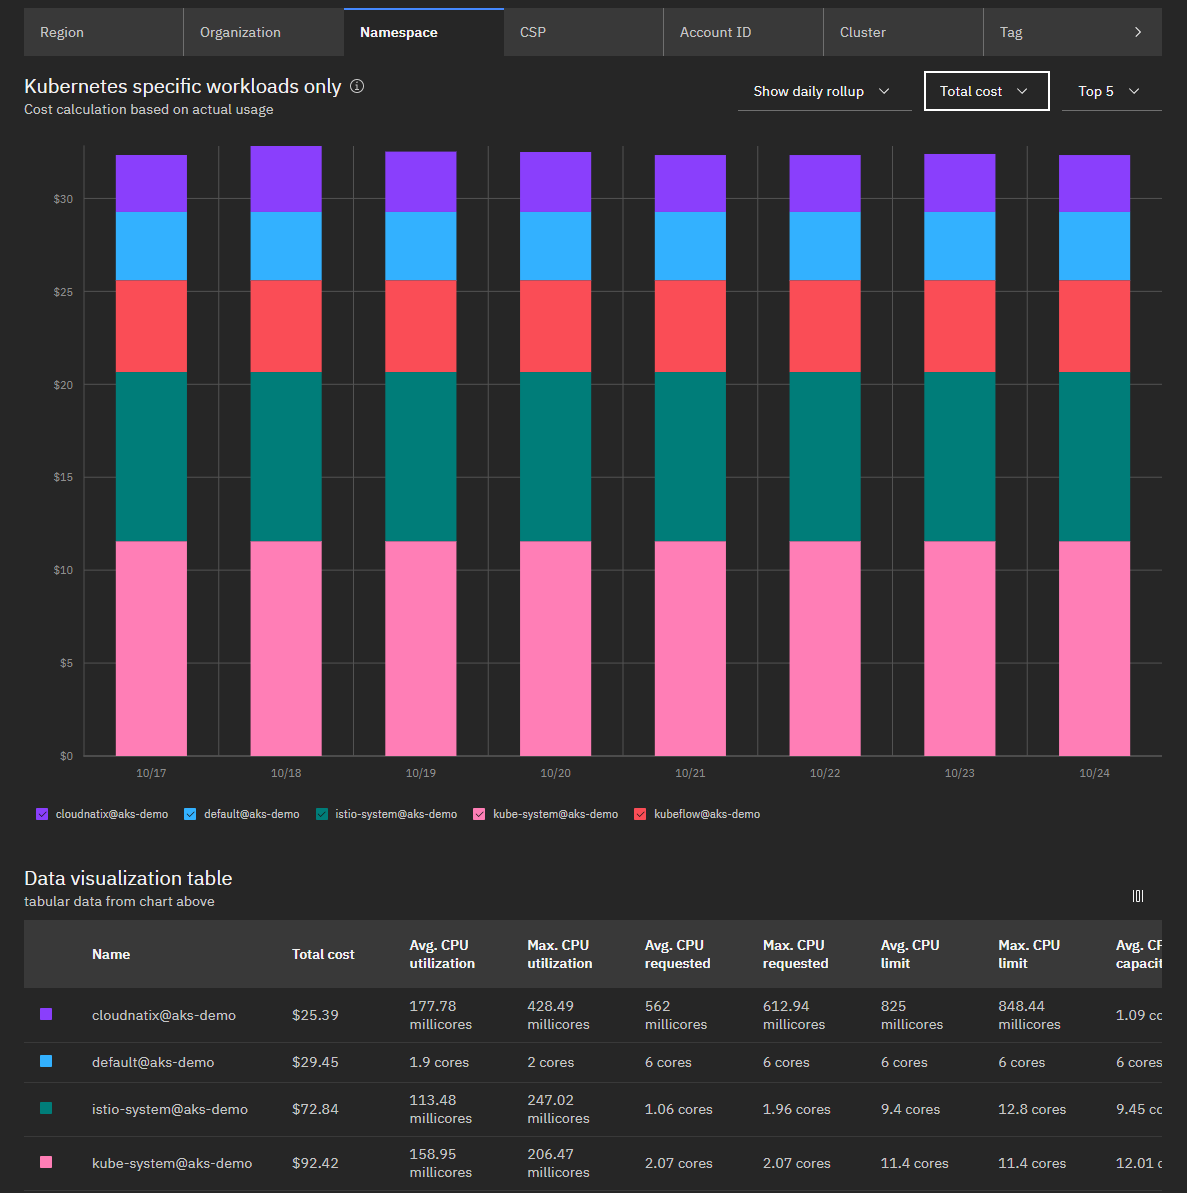
The cost of a namespace is calculated based on the resource requests of the workloads running in the namespace.
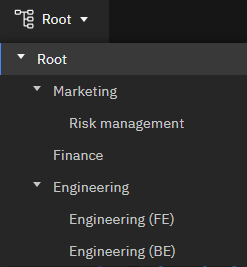
Grouping with Organization
By default, CloudNatix Dashboard shows the entire Organizational topology that the currently logged-in user has access to and all its sub-organizations.
The Organizational topology switcher can be found on top left corner of the dashboard. The user has the ability to switch the Dashboard view to the appropriate organization.