

Tutorial
Step 4. Understand Your Infrastructure from Dashboard
CloudNatix Dashboard provides the performance and cost data for the entire infrastructure that users have. It can aggregate data across multiple different environments and allows users to understand cost trend and identify inefficiencies.
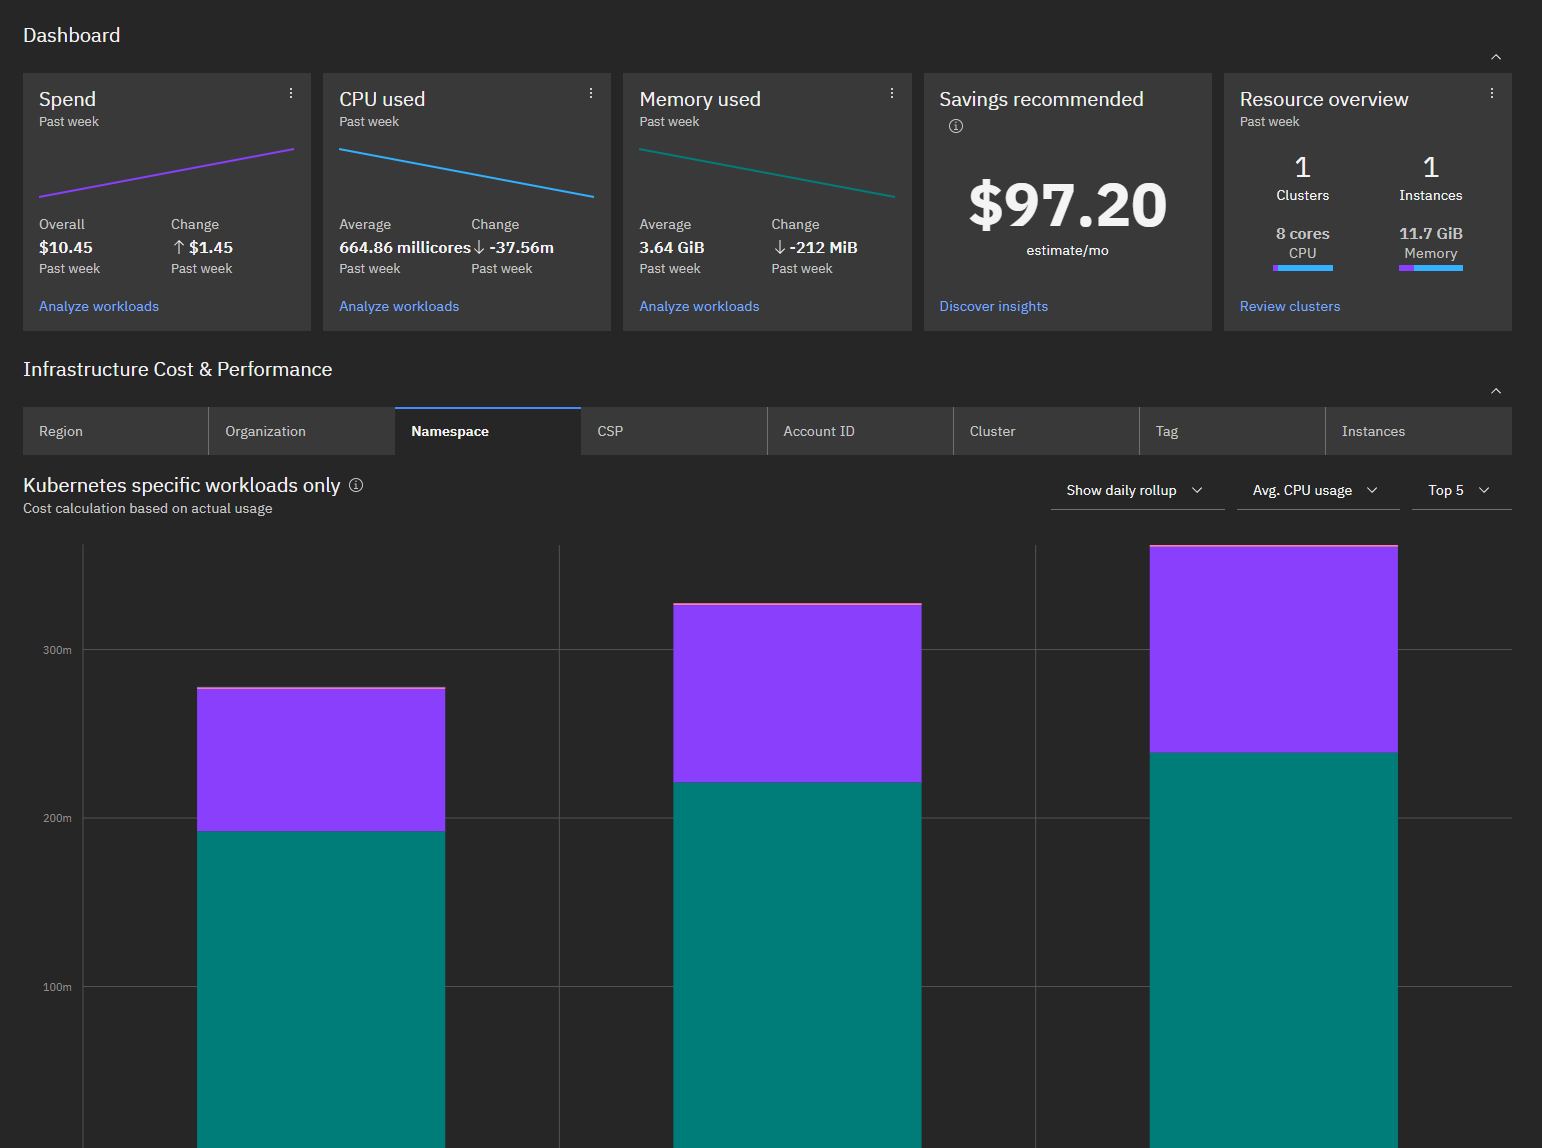
In this tutorial, we can see the cost and performance of the Kind cluster. The cost data is based on some predefined artificial pricing data. Public pricing information is used if the underlying environment is AWS, Azure, and GCP.
The top section of the dashboard provides bird's-eye view with guided next steps. The bottom section of the dashboard displays more detailed information, and you can view data categorized by region, organization, namespace, Cloud Service Provider (= CSP), etc.
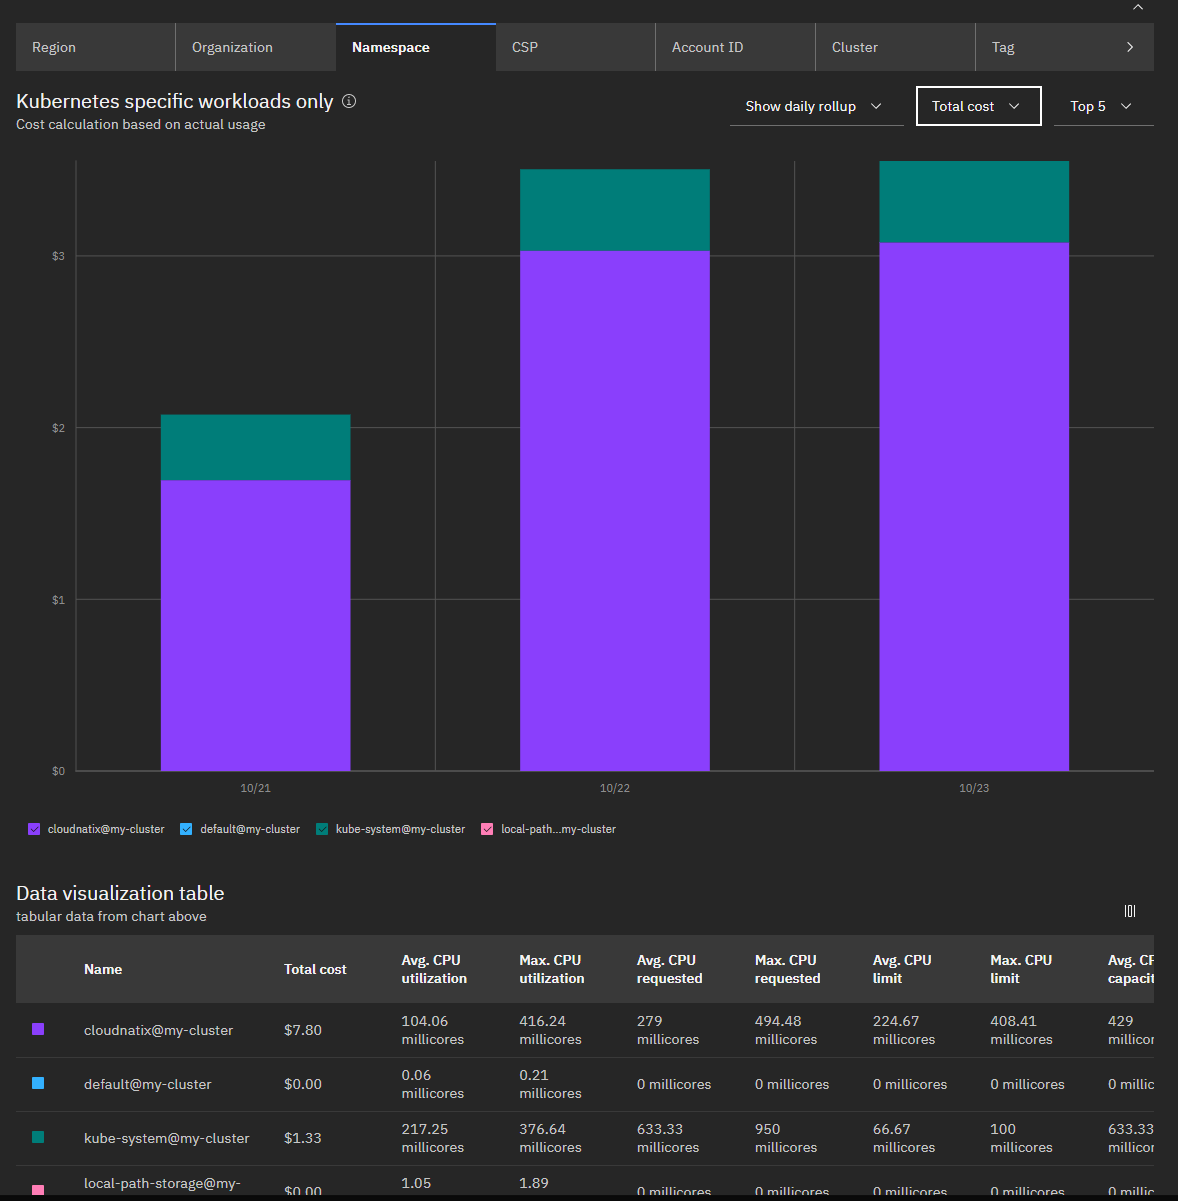
The "Namespace" tab shows the cost and performance data grouped by Kubernetes namespaces. As shown in the screenshot below, you can easily identify which namespaces are more expensive than others and their resource efficiency. The cost of a namespace is calculated based on the resource requests of the workloads running the namespace.
Please see Understanding Infrastructure Cost and Efficiency from Dashboard for more details.