

User Guide
Datadog integration
CloudNatix offers the feature of Datadog integration; it means that some metric data points of CloudNatix can be sent to Datadog. If you're already using Datadog and want to view CloudNatix data points there, This integration provides a seamless experience if you're already using Datadog and want to view CloudNatix data points along with existing Datadog metrics.
Please also visit https://app.datadoghq.com/integrations/cloudnatix to know about the integration.
Setup
The setup required is very minimal as the integration can be done simply through the Openmetrics feature of Datadog.
You just need to install Datadog agent into your Kubernetes cluster if you haven't. See here for the details. Our latest clusteragent (since v0.225.0) already sets up the AutoDiscovery configuration in its pod spec, so that Datadog can collect the metrics and report to the Datadog backend.
Dashboard and metrics
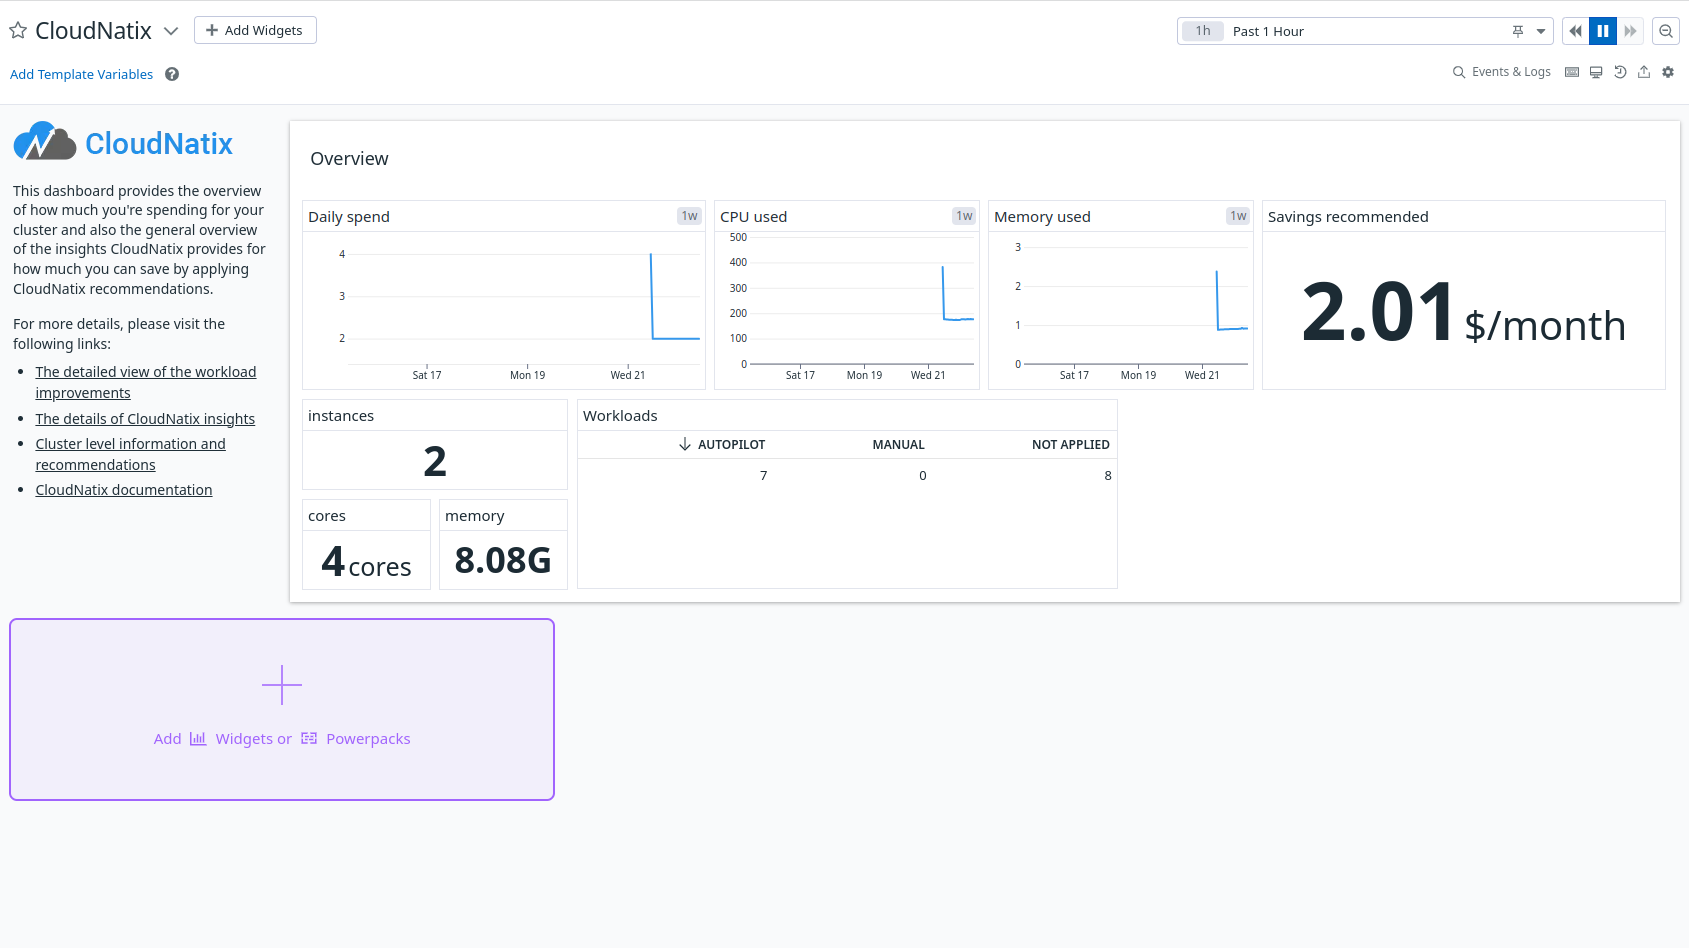
CloudNatix Datadog integration also offers the dashboard you can use. It depicts the collected data points nicely.
Here is also the list of the metrics it can report in case you want to play with those data points by yourself.
cloudnatix.workload.resource: the requested resources (CPU and memory) for the workloads in the cluster.cloudnatix.vpa.recommendation: the recommended resources (CPU and memory) for the workloads in the cluster.cloudnatix.workload.monthly_spend: the estimated spend (cost in dollars) for a month for the workloads in the cluster.cloudnatix.workload.projected_saving: the estimated projected savings for a month for the workloads in the cluster if the autopilot is enabled to the workload.cloudnatix.vpa: the VPA mode status per workload.cloudnatix.pod_eviction_by_vpa: the number of pods evicted by VPA.cloudnatix.compute.daily_spend: the total daily spend of the nodes in the cluster.
Disable Datadog integration
If you want to suppress sending metrics to Datadog explicitly, you could customize that by specifying none to reportToDatadog settings of cloudnatix ccoperator, e.g.
helm upgrade -n cloudnatix --set reportToDatadog=none ccoperator ~/.cnatix/cluster-configs/(cluster-name)/ccoperator
Appendix: CloudNatix integration
Although the default Openmetrics configuration would be sufficient, we also offer the integration script to send the metrics. The functionality is completely same, but you can take this approach if it fits better with your workflow for Datadog.
- Build your own docker image of Datadog agent, and install CloudNatix integration there. See here for the details.
- Set
reportToDatadogvariable tointegrationin ccoperator so that cloudnatix clusteragent will configure itself to use cloudnatix integration instead of openmetrics integration.
helm upgrade -n cloudnatix --set reportToDatadog=integration ccoperator ~/.cnatix/cluster-configs/(cluster-name)/ccoperator