

User Guide
Installing CloudNatix to VM Environments
Overview
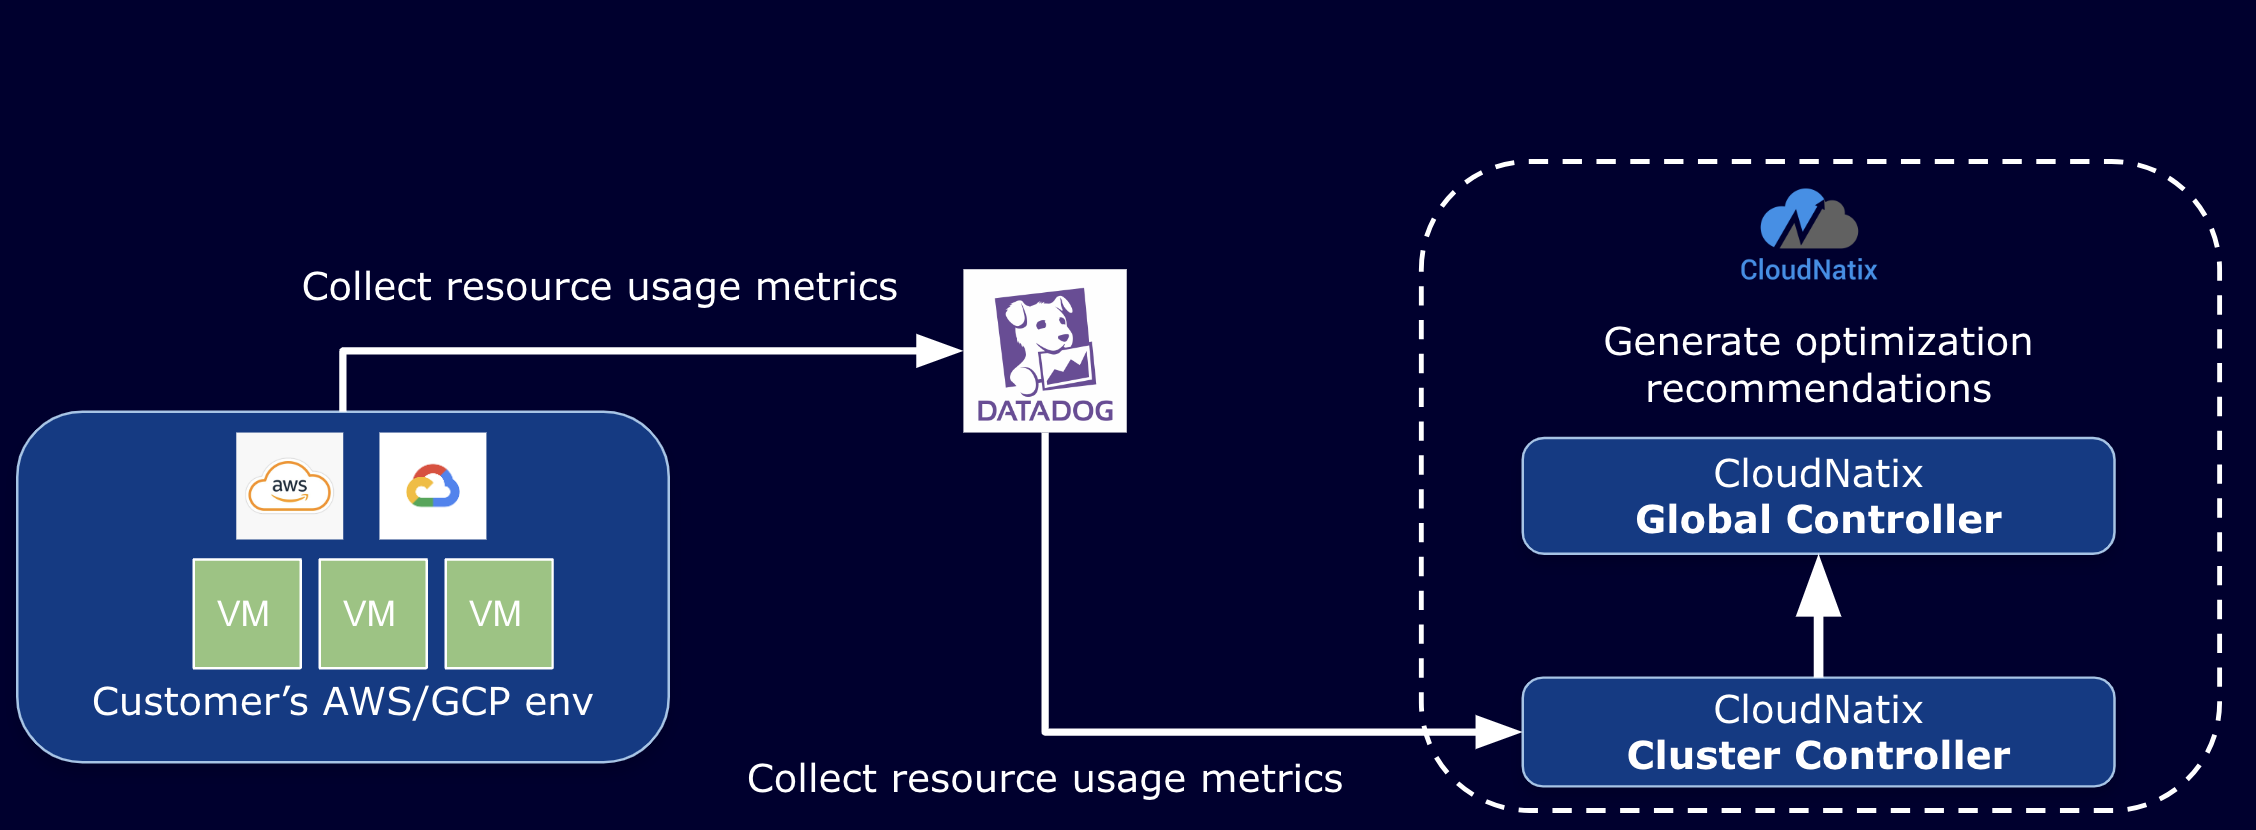
We would like to provide the visibility and optimization feature of CloudNatix to a VM-based environment. The following is an architecture diagram that shows that Cluster Controller hosted in the CloudNatix environment monitors the infrastructure.
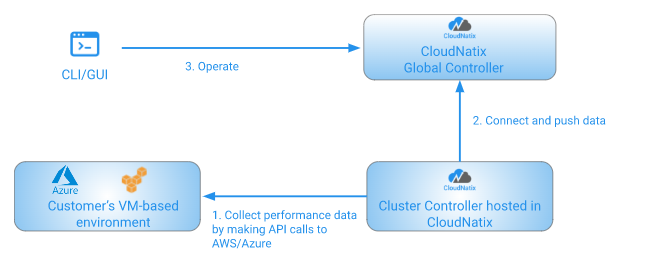
Alternatively, you can allow CloudNatix Global Controller to call the APIs of the cloud providers to collect the metrics instead of setting up the Cluster Controller.
Currently AWS, Azure, GCP, and OCI are supported for the access from Global Controller.
Installation Procedure for AWS
The installation consists of two steps:
- Create an IAM role that grants read-only permission to CloudNatix.
- Install CloudWatch Agent in each VM.
- (optional) Register the IAM role to CloudNatix Global Controller so that it can monitor.
Step 1. Create an IAM Role
We would like to have an IAM role that grants the following read-only permissions to CloudNatix:
ec2:Describe*- alternatively,
ec2:DescribeInstances,ec2:DescribeInstanceTypes,ec2:DescribeVolumes, andec2:DescribeRegions
- alternatively,
cloudwatch:ListMetricscloudwatch:GetMetricDatacloudwatch:GetMetricStatistics
In addition to the above read-only permissions, the following permissions are needed to enable scheduled start/stop/resize of EC2 instances:
ec2:StartInstancesec2:StopInstancesec2:ModifyInstanceAttribute
To create the role, first please run the following command to obtain the "external ID" used in the policy data.
cnatix infrastructure monitoring external-id
please run the following commands:
aws iam create-role \
  --role-name CloudNatixClusterController \
  --assume-role-policy-document file://<path to trust-policy.json>

aws iam put-role-policy \
  --role-name CloudNatixClusterController \
  --policy-name CloudNatixClusterControllerPolicy \
  --policy-document file://<path to perm-policy.json>
Here is the content of trust-policy.json.
{
  "Version": "2012-10-17",
  "Statement": [
    {
      "Sid": "",
      "Effect": "Allow",
      "Principal": {
        "Service": "ec2.amazonaws.com"
      },
      "Action": "sts:AssumeRole"
    },
    {
      "Sid": "",
      "Effect": "Allow",
      "Principal": {
        "AWS": "arn:aws:iam::803339316953:role/GlobalClusterWatcherProd"
      },
      "Action": "sts:AssumeRole",
      "Condition": {
        "StringEquals": {
          "sts:ExternalId": "<the external ID shown in cnatix CLI>"
        }
      }
    }
  ]
}
Here is the content of perm-policy.json.
{
  "Version": "2012-10-17",
  "Statement": {
    "Effect": "Allow",
      "Action": [
          "ec2:Describe*",
          "cloudwatch:ListMetrics",
          "cloudwatch:GetMetricData",
          "cloudwatch:GetMetricStatistics"
    ],
    "Resource": "*"
  }
}
Once the IAM role is created, please share the IAM role ARN to CloudNatix.
Step 2. Install CloudWatch Agent to Target VMs
Step 2a. Configure the IAM role attached to an EC2 instances
Give the CloudWatchAgentServerPolicy permission to the EC2 instance to be monitored.
If you don’t have an existing IAM role, create a new IAM role that has the CloudWatchAgentServerPolicy permission.
Step 2b. Install AWS CloudWatch Agent to the EC2 instance
Follow this page and install AWS CloudWatch Agent.
Here are example installation commands.
Amazon Linux 2:
sudo yum install amazon-cloudwatch-agent
Debian:
wget https://s3.amazonaws.com/amazoncloudwatch-agent/ubuntu/amd64/latest/amazon-cloudwatch-agent.deb
sudo dpkg -i -E ./amazon-cloudwatch-agent.deb
Windows:
Run the following from PowerShell:
(New-Object Net.WebClient).DownloadFile('https://s3.amazonaws.com/amazoncloudwatch-agent/windows/amd64/latest/amazon-cloudwatch-agent.msi', 'amazon-cloudwatch-agent.msi')

msiexec /i amazon-cloudwatch-agent.msi
Step 2c. Update CloudWatch Agent Configuration and Restart
Overwrite the default CloudWatch Agent configuration to CloudNatix specific one. Then restart the CloudWatch Agent.
Linux:
sudo tee /opt/aws/amazon-cloudwatch-agent/etc/amazon-cloudwatch-agent.json << EOF

{
        "agent": {
                "metrics_collection_interval": 60,
                "run_as_user": "root"
        },
        "metrics": {
                "append_dimensions": {
                        "InstanceId": "\${aws:InstanceId}"
                },
                "metrics_collected": {
                        "disk": {
                                "measurement": [
                                        "used_percent"
                                ],
                                "metrics_collection_interval": 60,
                                "resources": [
                                        "*"
                                ]
                        },
                        "mem": {
                                "measurement": [
                                        "mem_used_percent"
                                ],
                                "metrics_collection_interval": 60
                        }
                }
        }
}
EOF

sudo systemctl enable amazon-cloudwatch-agent
sudo systemctl restart amazon-cloudwatch-agent
You can also use used_percent instead of mem_used_percent.
Windows:
Put the following file at C:\Program Files\Amazon\AmazonCloudWatchAgent\config.json.
{
    "metrics": {
        "append_dimensions": {
            "InstanceId": "${aws:InstanceId}"
        },
        "metrics_collected": {
            "LogicalDisk": {
                "measurement": [
                    "% Free Space"
                ],
                "metrics_collection_interval": 60,
                "resources": [
                    "*"
                ]
            },
            "Memory": {
                "measurement": [
                    "% Committed Bytes In Use"
                ],
                "metrics_collection_interval": 60
            }
        }
    }
}
Then run
& 'C:\Program Files\Amazon\AmazonCloudWatchAgent\amazon-cloudwatch-agent-ctl.ps1' -a fetch-config -m ec2 -s -c file:'C:\Program Files\Amazon\AmazonCloudWatchAgent\config.json'
NOTE: If you have multiple configuration files to manage and you don’t want to overwrite the existing one, please follow the instruction from AWS instruction and create a separate configuration file:
NOTE: If you currently manage CloudWatch Agent configuration with AWS Systems Manager Parameter Store, change the configuration there.
Step 2d. Verify the Installation Status
Run the following command to verify the status of the installation.
Linux:
/opt/aws/amazon-cloudwatch-agent/bin/amazon-cloudwatch-agent-ctl -a status
Windows:
& 'C:\Program Files\Amazon\AmazonCloudWatchAgent\amazon-cloudwatch-agent-ctl.ps1' -a status
Here is an example output. If the “status” is “running”, the installation has successfully completed.
{
  "status": "running",
  "starttime": "2021-09-02T20:38:02+00:00",
  "configstatus": "configured",
  "cwoc_status": "stopped",
  "cwoc_starttime": "",
  "cwoc_configstatus": "not configured",
  "version": "1.247349.0b251399"
}
Step 3. (optional) Register the IAM role to CloudNatix Global Controller
If you want CloudNatix Global Controller to monitor VMs directly rather than setting up Cluster Controller, run the following command to register the information to the Global Controller.
cnatix infrastructure monitoring create \
  --type=aws \
  --iam-role-arn=<IAM role ARN>
Here, account-id is the numeric identifier of your account, and the IAM role ARN would be the ARN of the role created by the aws iam create-role command.
Uninstallation Procedure for AWS
Please delete the IAM role CloudNatixClusterController, which is created in the installation process.
If you registered the IAM role to CloudNatix Global Controller, please deregister it. You can deregister through the account ID, or the ID of the config itself (the ID is available on the output of cnatix infrastructure monitoring create command, or cnatix infrastructure monitoring list command).
cnatix infrastructure monitoring delete \
  --type=aws \
  --account-id=<your account id>
or
cnatix infrastructure monitoring delete --id=<config ID>
If you want to uninstall CloudWatch Agent, please run the following command:
Amazon Linux 2:
sudo yum remove amazon-cloudwatch-agent
Debian:
sudo dpkg -r amazon-cloudwatch-agent
Windows:
Uninstall-Package -Name "Amazon CloudWatch Agent"
Please also revert the change to AWS Systems Manager Parameter Store if you manage CloudWatch Agent configuration with AWS Systems Manager Parameter Store and updated it during the installation process.
Installation Procedure for Azure
The installation is done by creating an Azure service principal that has the Monitoring Reader role. The service principal is used by Cluster Controller to collect performance data, including
- Virtual Machines metadata (e.g., VM type, operating system)
- Virtual Machine ScaleSets metadata (e.g., VM type, operating system)
- CPU and memory utilization of VMs
To create a service principal, run the following command:
az ad sp create-for-rbac \
  --name <service principal name> \
  --role 'Monitoring Reader' \
  --scopes <list of subscriptions to be monitored> \
  --create-cert
Please share the generated appID, tenantID and the certificate to CloudNatix.
If you want to create a service principal from Azure portal, follow the following steps.
- Go to Azure Active Directory.
- Select "App Registrations".
- Click "New Registration".
- Add a certificate.
- Go to "Subscriptions" and select the target subscription.
- Select "Access Control (IAM)". Click "Add" and choose "Add role assignment".
- Select "Reader" and click "Next".
Set up workload identity federation for Azure
Azure allows "federated credentials", which can be used for our global controller backend to monitor resources. See here for the detailed information.
Step 1. create a managed identity
Go to Azure Portal and search "managed identities" from the search bar. Create a "managed identity" for our access. Specify the region and a name for the identity.
Step 2. allow required accesses to the managed identity
In Azure Portal, go to the resource group which the managed identity belongs to, set up the accesses for the managed identity as:
- Click "Access Control (IAM)" in the left bar
- Click "Add" and select "Add role assignment"
- Select the related roles (e.g. "Reader")
- In the "members" tab, Select the managed identity created above
- Click "Review+Assign" button
Step 3. allow federated credentials
- In Azure Portal, go to the managed instance page.
- Click the "Federated credentials" in the left bar under "Settings" section.
- Click "Add Credentials"
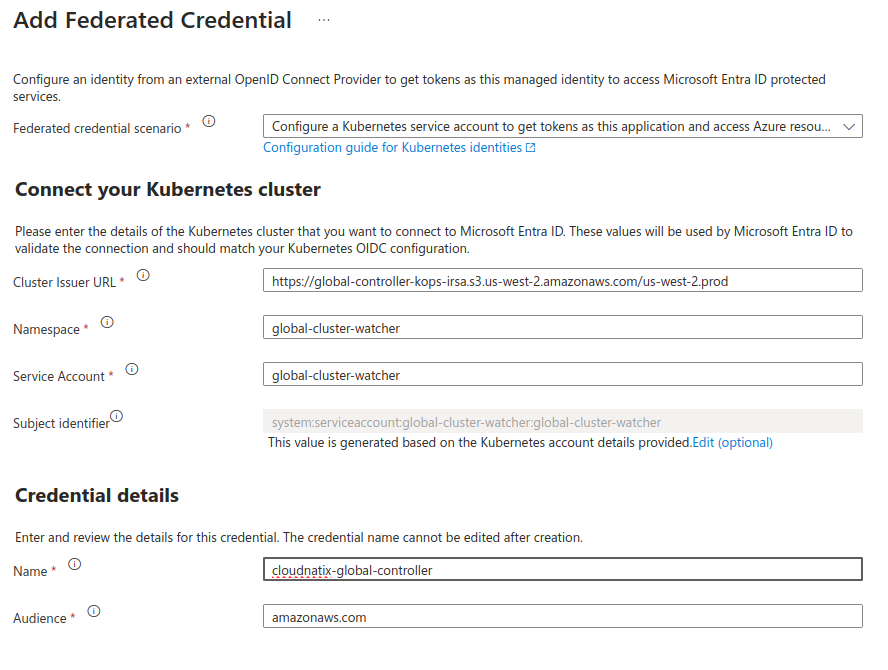
- Select "Kubernetes accessing Azure resources" for "Federated credentials scenario"
- Set the following parameters:
- Cluster Issuer URL:
https://global-controller-kops-irsa.s3.us-west-2.amazonaws.com/us-west-2.prod - Namespace:
global-cluster-watcher - Service Account:
global-cluster-watcher
- Cluster Issuer URL:
- Click the "Edit (optional)" for "Audience", and update to
amazonaws.com. - Set the name for this as you like (e.g. "cloudnatix-global-controller").
- Click "Add"
Uninstallation Procedure for Azure
Please delete the service principal created in the installation process.
Installation Procedure for GCP
Step 1: Create a service account
Please create a service account that has the Compute Viewer role and the Monitoring Viewer role.
The service account is used by Cluster Controller to collect performance data, including
- GCE instances metadata (e.g., VM type, operating system)
- CPU and memory utilization of GCE instances
If you like to fine-tune the access of the APIs, here are the list of APIs we're currently using.
compute.instances.listcompute.machineTypes.listcompute.zones.listmonitoring.metricDescriptors.listmonitoring.timeSeries.list
You can specify those ones instead of broader Compute Viewer and Monitoring Viewer.
Step 2: Set up the Workload Identity Federation
The Workload Identity Federation is the feature to grant access of service accounts to external parties like us. See here for the documentation. Please follow the OIDC configuration steps for the actual set up.
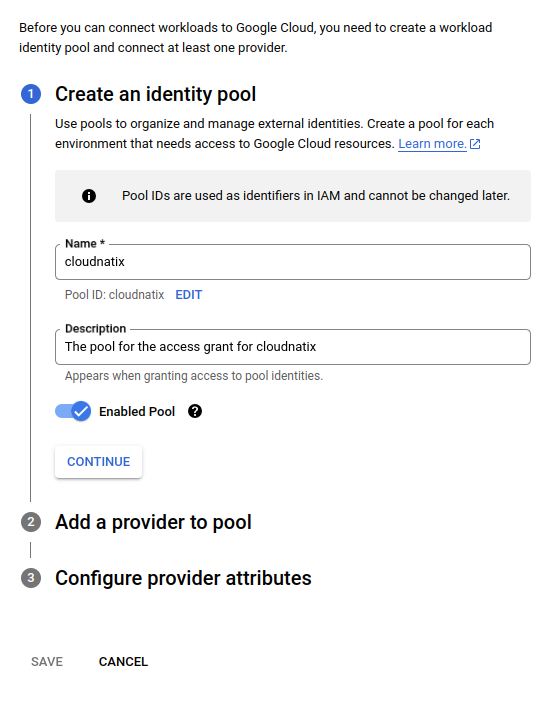
Step 2a. create a workload identity pool
Go to IAM & Admin > Workload Identity Pool page, and click CREATE POOL to create a new pool. A pool can manage a set of "providers" and grants.
In the dialog you can put any name and description which suit you.
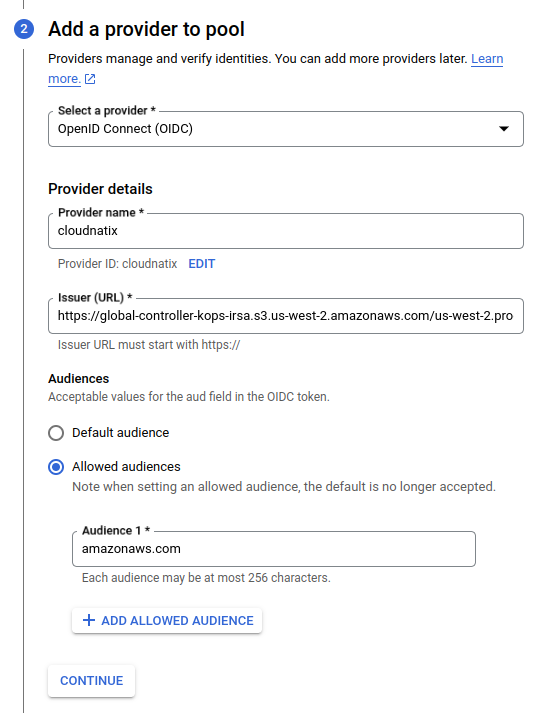
Step 2b. create a workload identity provider
The next step is the creation of the provider. The provider setup is actually integrated into the pool setup UI, so here would be the one when you you hit the CONTINUE button.
- select "OIDC" for the provider
- set a name for the provider (
cloudnatixin this screenshot) - the issuerURL should be
https://global-controller-kops-irsa.s3.us-west-2.amazonaws.com/us-west-2.prod - Select "Allowed Audiences" and add
amazonaws.com.
Then set up the attributes mappings. Put assertion.sub for google.subject. We don't need any extra mappings but you can add them as you like.
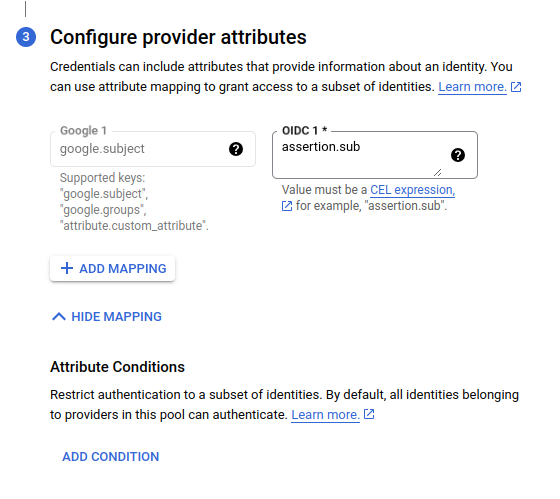
After that, click the SAVE button.
Step 2c. grant the access
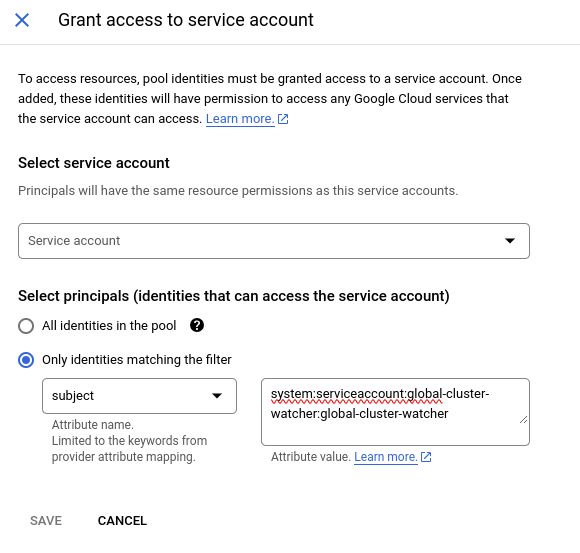
Once created the pool and the provider, finally you can grant the access. Click GRANT ACCESS button.
- select your created service account.
- in the "Select principals" section, add
system:serviceaccount:global-cluster-watcher:global-cluster-watcherforsubject.
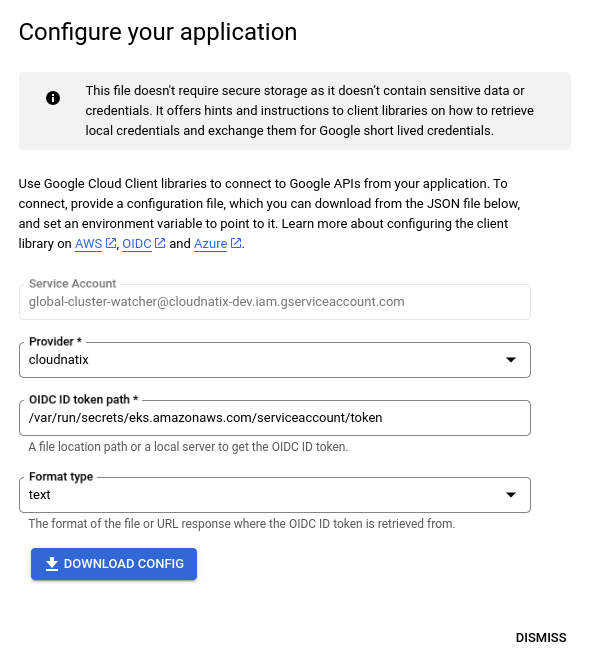
Click the SAVE button. This will show up another dialog to download the JSON file. For downloading, put /var/run/secrets/eks.amazonaws.com/serviceaccount/token to the "OIDC ID token path" field.
Once you get the JSON file, you can send the JSON file to us. The JSON file does not have secret data but has the information for how to obtain the access grant.
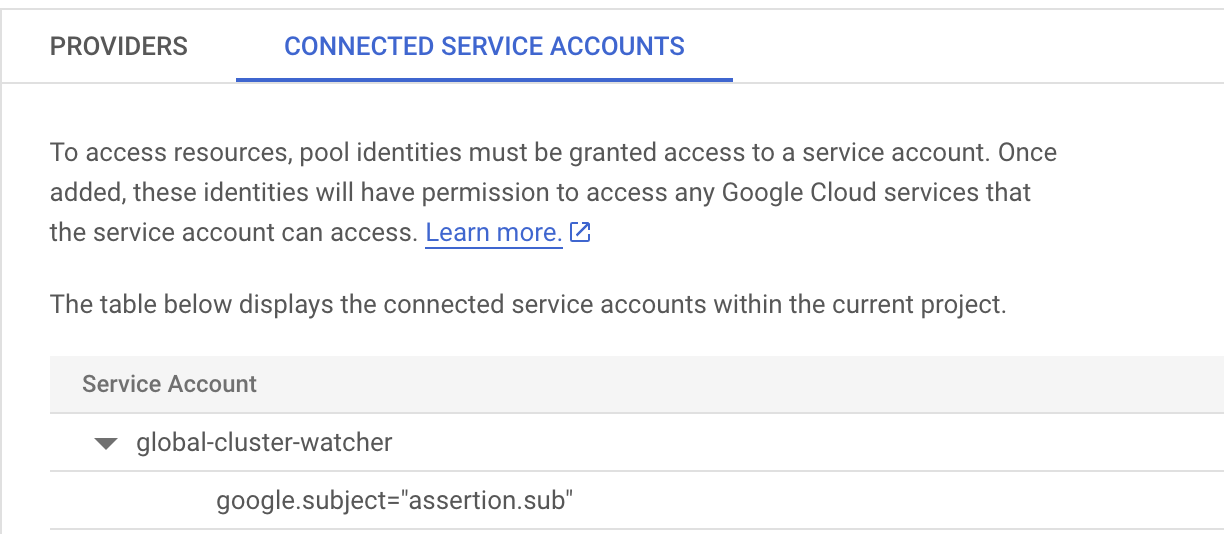
Please confirm that the connected service account has the filter on google.subject="assertion.sub" for identity mapping.
Step 3: install Cloud Monitoring agent
Please follow this Ops Agent guide and install the Cloud Monitoring agent on individual VMs.
Step 4: (optional) Register the credentials JSON file to CloudNatix Global Controller
If you want CloudNatix Global Controller to monitor VMs directly rather than setting up Cluster Controller, run the following command to register the information to the Global Controller.
cnatix infrastructure monitoring create \
  --type=gcp \
  --project-id=<your project id> \
  --credentials-file=<path to the downloaded JSON file>
Here, the project-id is either the numeric identifier or the alphabetical identifier of your account, and the path to the JSON file downloaded at Step 2c.
Uninstallation Procedure for GCP
Please delete the service account, the workload identity pool, and the provider created in the installation process (or simply you can revoke the access grant).
If you registered the credentials to CloudNatix Global Controller, please deregister it. You can deregister through the project ID, or the ID of the config itself (the ID is available on the output of cnatix infrastructure monitoring create command, or cnatix infrastructure monitoring list command).
cnatix infrastructure monitoring delete \
  --type=gcp \
  --project-id=<your project id>
or
cnatix infrastructure monitoring delete --id=<config ID>
Installation Procedure for OCI
The installation is done by creating an OCI user, group, and policy that grant the user with read-only access to OCI APIs. The user is used by Cluster Controller to collect performance data, including
- Virtual Machines metadata (e.g., VM type, operating system)
- CPU and memory utilization of VMs
Set up a group
To create an OCI group, run the following command:
oci iam group create \
  --description "Group for cloudnatix" \
  --name "CloudNatix"
Set up a policy
First create a policy file in json format, e.g.:
cat oci_global_cluster_watcher.json
{
  "compartmentId": "ocid1.tenancy.oc1..***",
  "description": "Cloudnatix read-only policy",
  "name": "CloudNatix",
  "statements": [
    "Allow group 'Default'/'CloudNatix' to read all-resources in tenancy"
  ]
}
Then create the policy by running the following command:
oci iam policy create \
  --from-json file://oci_global_cluster_watcher.json
Set up a user
To create an OCI user, run the following command:
oci iam user create \
  --description "User for cloudnatix" \
  --name "tenant-name@cloudnatix.com" \
  --email "tenant-name@cloudnatix.com"
Then, add the user to the group created above by running the following command:
oci iam group add-user \
  --group-id ocid1.group.oc1..*** \
  --user-id ocid1.user.oc1..***
Then, optionally, generate an API signing key pair and share the generated private-key with CloudNatix.
You may also create the user, group and policy through OCI web portal.
(optional) Register the credentials with CloudNatix Global Controller
If you want CloudNatix Global Controller to monitor OCI VMs directly rather than setting up Cluster Controller, run the following command to register the information to the Global Controller.
cnatix infrastructure monitoring create \
  --type oci \
  --tenant-ocid=<ocid1.tenancy.oc1..***> \
  --user-ocid=<ocid1.user.oc1..***> \
  --compartment-ocid=<ocid1.tenancy.oc1..***> \
  --finger-print=<the fingerprint of your public key> \
  --private-key-file==<path to your private key file>
Uninstallation Procedure for OCI
Please delete the policy, user, and group created in the installation process.
If you registered the credentials to CloudNatix Global Controller, please deregister it. You can deregister through the project ID, or the ID of the config itself (the ID is available on the output of cnatix infrastructure monitoring create command, or cnatix infrastructure monitoring list command).
cnatix infrastructure monitoring delete \
  --type=gcp \
  --compartment-ocid=<your compartment ocid>
or
cnatix infrastructure monitoring delete --id=<config ID>
Use Datadog Metrics for VM Optimization Recommendations
CloudNatix provides an option for collecting the resource utilization information from Datadog. This option is useful when you already have Datadog Agent running on your VMs as you can get memory utilization metrics without installing AWS CloudWatch Agent or GCP Ops Agent.
Prerequisite
- Datadog Agent is running on each instance.
- EC2 instances use "resource name" for their host name types.
- GCE instances must not have custom hostnames.
Installation Steps
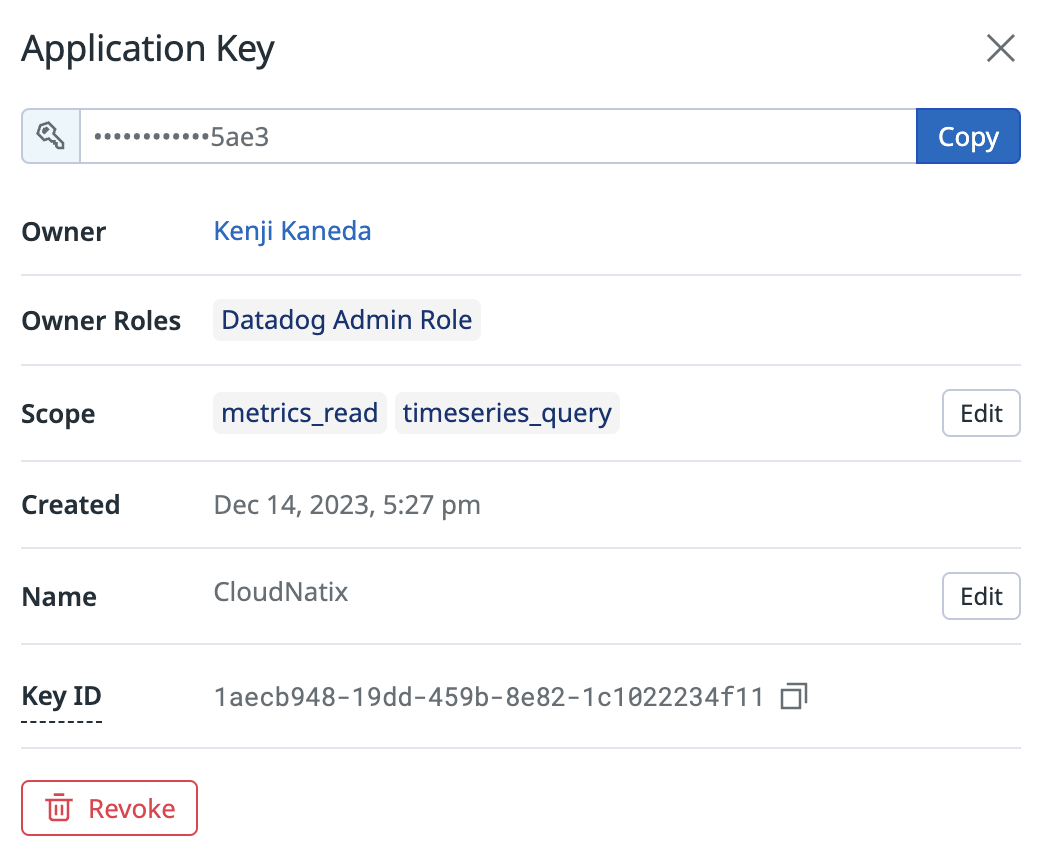
To enable the feature, CloudNatix requires a Datadog API key and Application key to access your Datadog metrics.
First, go to the "Organization Settings" page of Datadog and create a new API key and an application key. Please add the following scopes to the Application key:
timeseries_query: Query Timeseries data.metrics_read: View custom metrics.
Then run the following command to register the Datadog-based metrics collection:
cnatix infrastructure monitoring create \
  --type=datadog \
  --api-key=<api-key> \
  --app-key=<application-key>