Tutorial
Step 2. Interact with Your Workloads
It will take several time until data are fully populated in Dashboard. Meanwhile let's access the Workload page and interact with your workloads.
The Workload page is one of the main pages that CloudNatix offers. Users can take the following actions in the page:
- View workload data aggregated across multiple Kubernetes clusters
- Perform GUI operations equivalent to
kubectl logsandkubectl exec - Review and apply workload optimizations (this is explained later in Step 3)
- View historical information of the workloads (e.g., event history, spec change history)
Step 2.1. View a list of workloads
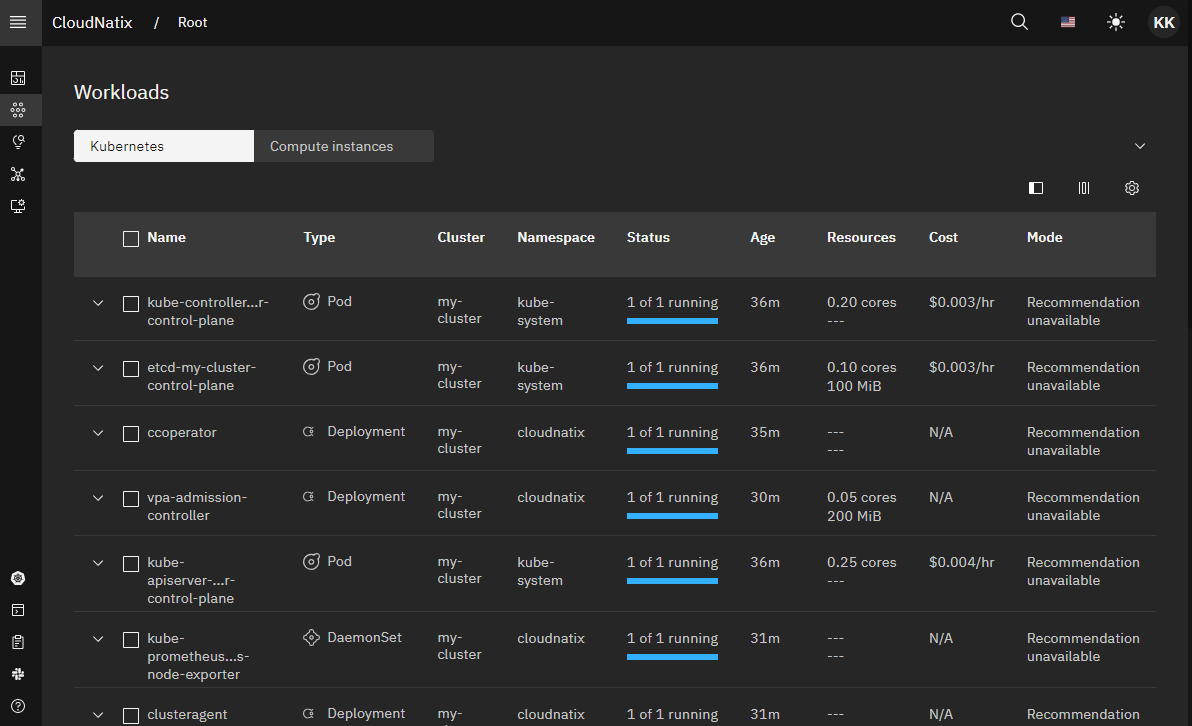
Let's go to the Workload page. The page shows a list of all workloads running in the Kind cluster and their status summaries such as kind, the number of pods and their statuses, resource requests/limits.
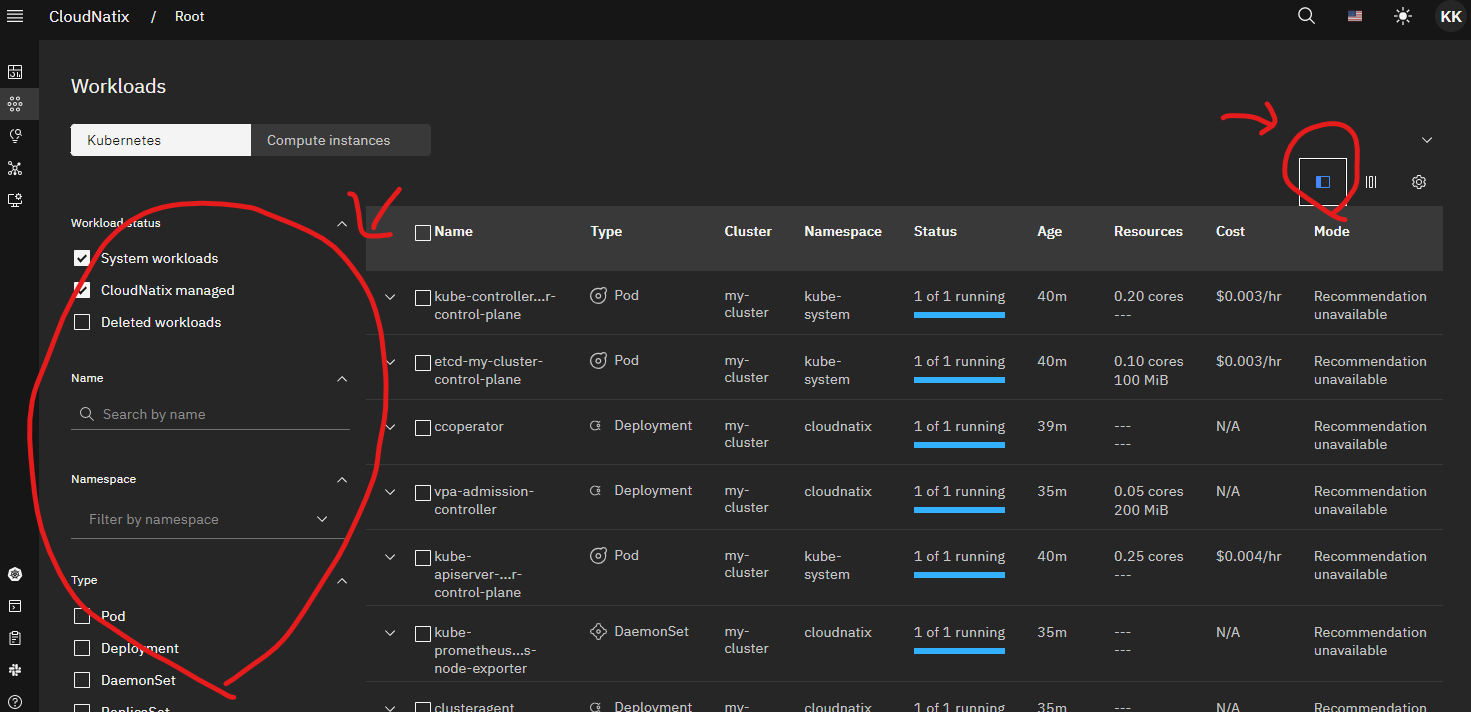
If you want to search a specific workload, click the filter icon at the right top of the table. Then the search/filter panel shows up at the 2left, and you can search a target workload by a name, namespace, and a cluster.
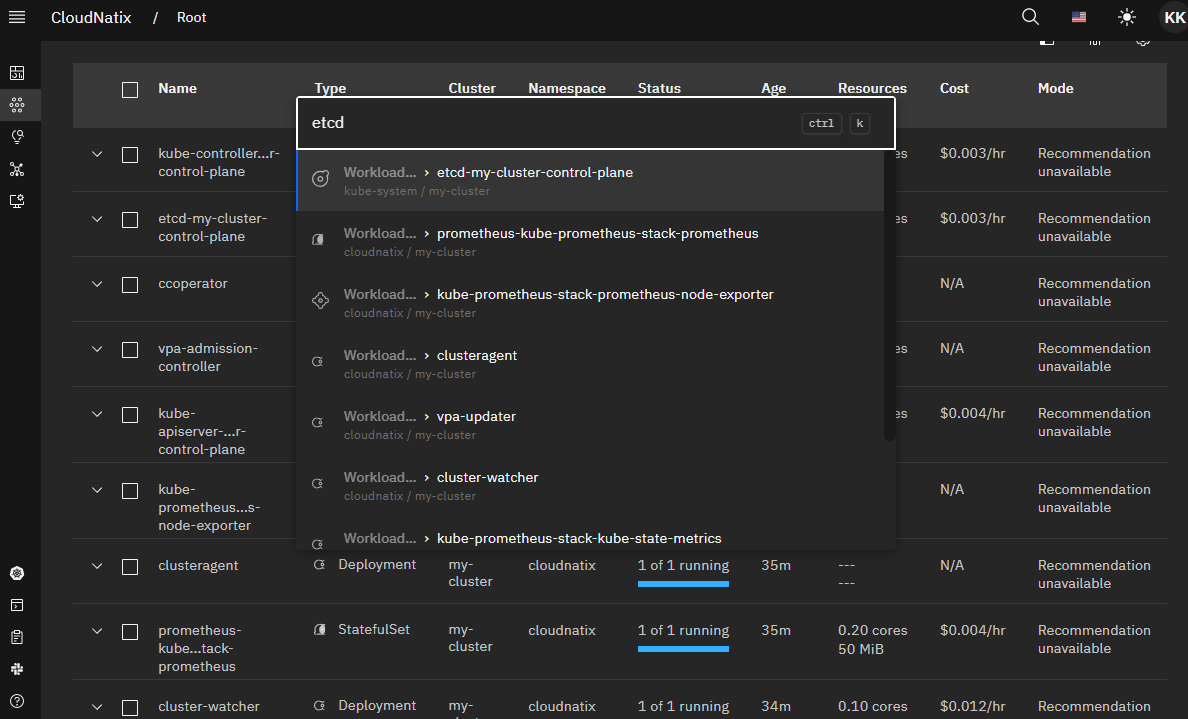
You can also the command palette for quick search. If you type Cmd-K or Cntl-K, the command palette shows up. Then you can just type a workload name there and jump into a target workload page.
Step 2.2. Create a new workload and view the update
The page is updated in a real-time fashion. You can verify by creating a new workload on the Kind cluster. For example, if you run the following command, the nginx workload will show up in the workload table.
kubectl create deployment nginx --image=nginx
Step 2.3. View workload costs
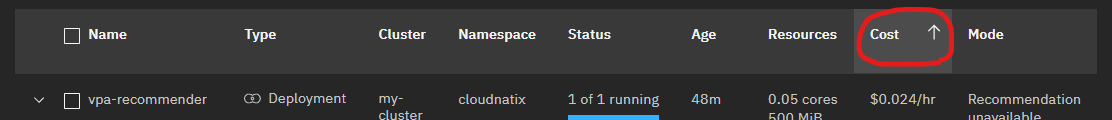
One interesting feature of this workload table is that it shows workload costs (the "Cost" column in the table. CloudNatix computes workload costs based on the resource requests/limits of individual workloads. You can click the column name to sort workloads by the cost and easily find expensive workloads running in your environments.
This workload table gets more interesting when you have multiple Kubernetes clusters. You can easily navigate through and find target workloads across multiple clusters.
Step 2.4. Access pod logs, exec into a container
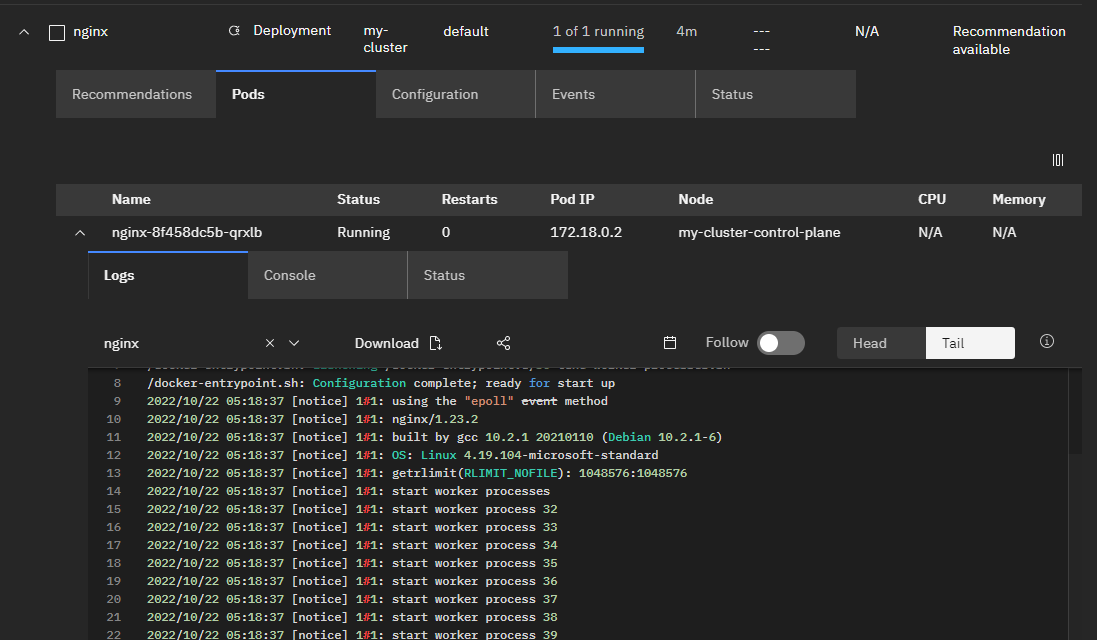
The Workload page is not just viewing workloads. You can interact with them. For example, you can see the log of a pod (like kubectl logs) and exec into a container (like kubectl exec).
You can take the following steps to access pod logs or exec into a container:
- Search a target workload
- Expand the workload by clicking the
vmark next to the workload name - Select the
Podstab - Choose a target pod and expand the pod by clicking the
vmark next to the pod name
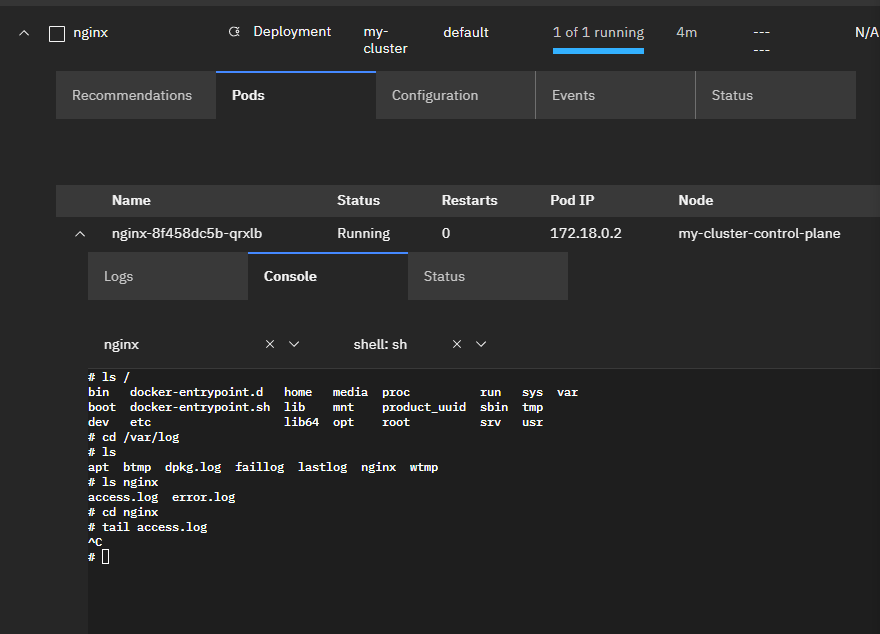
Then you can select the Console tab to exec into a container.
Step 2.5. View event history and spec change history
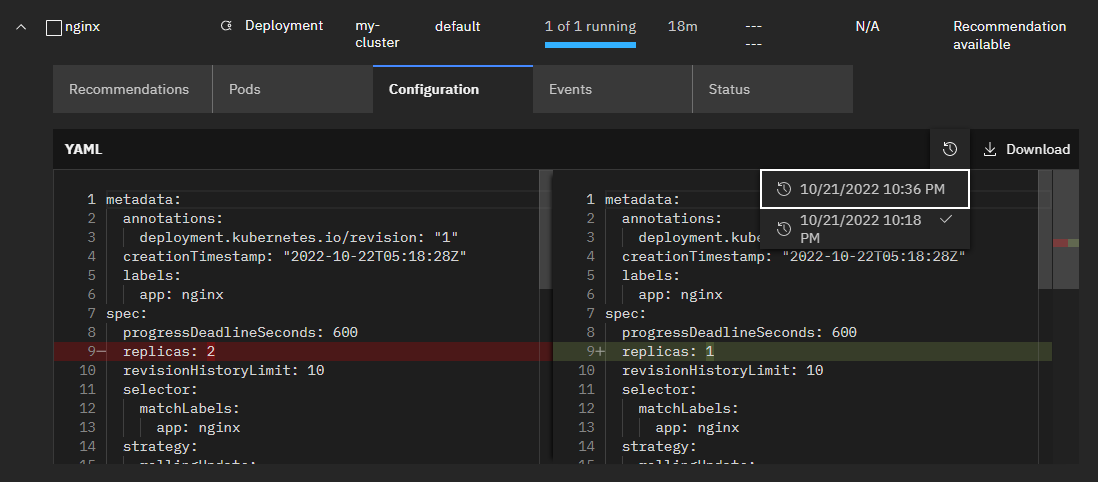
In addition to the functionality equivalent to kubectl, CloudNatix provide historical information of workloads as it internally stores historical changes that happened to workloads and clusters.
As an example, let's change the number of replicas of nginx.
kubectl scale deployment nginx --replicas 2
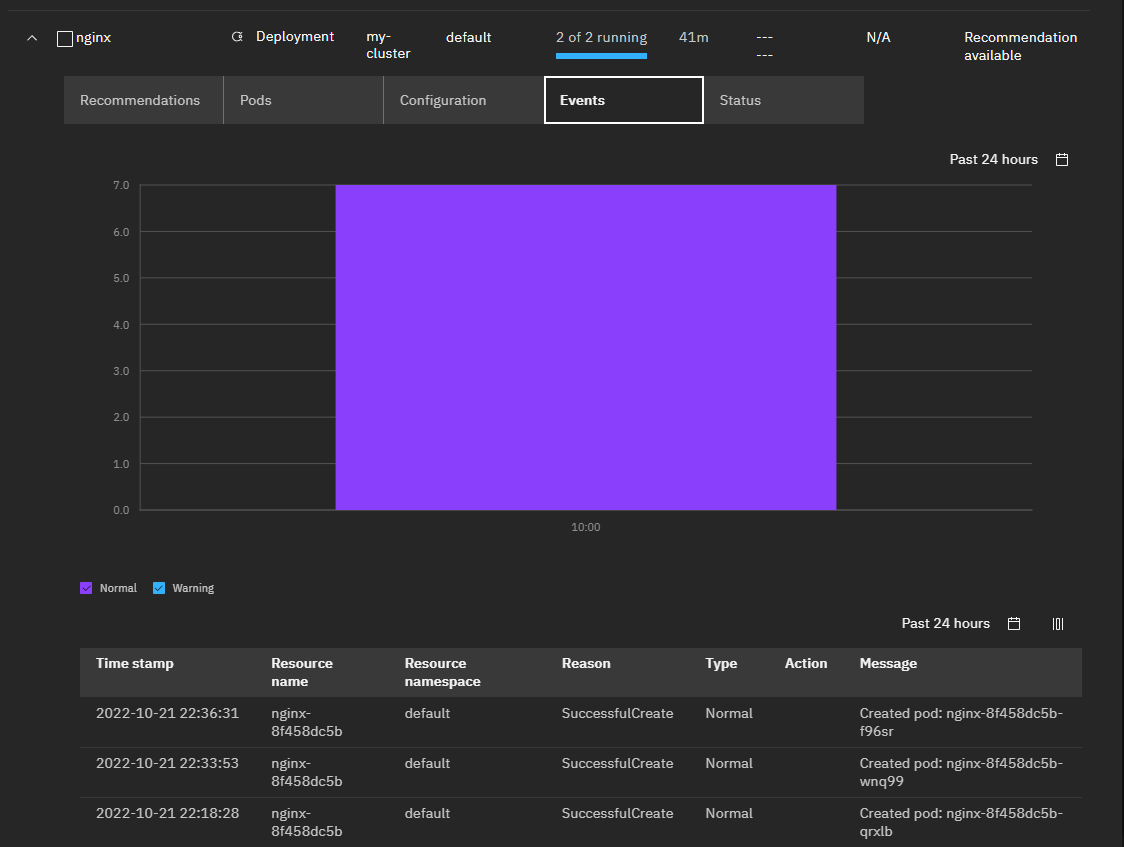
Then when you access the Configuration tab of nginx, the clock icon will show up. You can then select a timestamp and see what was the change made at that time.
You can also see the history of the events (pod creation) in the Events tab.